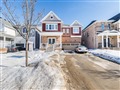
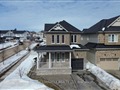
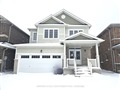
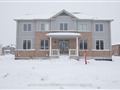
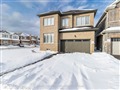
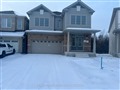
375 Jelly St
$542,534
Comparative Market Analysis
Jun 6, 2025
NOT AN ACTIVE LISTING
Historical Performance
| Period | $ Change | % Change |
| 1 Day | +$36 | +0.007% |
| 7 Days | -$315 | -0.058% |
| 30 Days | -$1,847 | -0.339% |
| 3 Months | -$2,526 | -0.463% |
| 6 Months | +$8,756 | +1.64% |
| 1 Year | -$28.2k | -4.95% |
| 3 Years | +$85.5k | +18.7% |
| 5 Years | +$139k | +34.3% |
| 10 Years | +$283k | +109% |
List My Property
Real Estate Statistics
Financing Solutions
Browsing History
454 Sandhill Crt, Shelburne
1 second ago
132 Marie St, Shelburne
2 seconds ago
AS SEEN ON


Are You a Licensed Real Estate Agent or Broker?